Introduction
With both parts of my bioprocessing primer out of the way, and enough news flow to make any company a battleground stock, it’s time to talk about Catalent.
Catalent is a CDMO that has evolved a lot since it went public around a decade ago. From 2013-2019, the company grew ~6% annualized, which at the surface is rather unimpressive. However, most of this growth came from 2017-onwards, thanks to a couple of key acquisitions that make it much more worth a look today.
If you had to point to one thing that Catalent got right, it was identifying the value of biologics assets early. It acquired Cook Pharmica, a biologics fill-finish specialist, in 2017, and Paragon, a gene therapy business focused on process development and manufacturing solution, in 2019. Before this point, only 14% of the company’s sales were from biologics, and most of that was packaging. As of its latest fiscal year, over 50% of Catalent’s sales came from biologics. Before you call me out for COVID revenues, I’d point out that without Cook and Paragon, Catalent may have been unable to enjoy the COVID bonanza at all.
Speaking of COVID, the pandemic began a series of events that has left Catalent with some serious egg on its face and investors with a lot of unanswered questions. Zooming out, I think there is still a lot to like with Catalent, in both its asset quality and the macro backdrop facing the whole industry it plays in.
Company Overview
While founded in 2007, Catalent has actually been around a long time - it used to be a segment within Cardinal Health, a large medical product distributor. Cardinal assembled the division with a rollup of manufacturing assets starting in the 90s until Blackstone purchased the asset and took it public in 2014.
Catalent’s claim to fame came from R.P Scherer, whose founder invented the rotary die encapsulation process, changing the softgel field forever. The other pieces of the rollup were more generic, consisting of a pharmaceutical packaging business and a process development company that looked a lot like a consulting business at the time.
Since segments have consolidated, I’m using 4Q22 numbers to adjust as much as possible for COVID while still capturing the most granular possible assignment of revenue.
Softgel and Oral Technologies (“SOT”, 26% of revenue, 28% EBITDA margin)
Catalent wasn’t always in focus for its biologics capabilities, but rather its expertise in putting things into softgels, which goes beyond pharma. Catalent offers a wide variety of softgel formats for its customers, as well as the traditional solids format (where you are just pressing chemicals into pills). This includes Bettera, the supplement business Catalent bought in FY22.
The specific services Catalent provided here was both commercial manufacturing as well as the ancillary services that go around it, such as formulation and development. However, commercial manufacturing was ~87% of this mix by the end of 2022.
Oral and Specialty Delivery (“OSD”, 13% of revenue, ~34% margin*)
OSD sounds and seems a lot like SOT, since they both involve oral delivery of substances, but the way I think about it is that SOT is a little more consumer-facing from an end-market standpoint. This segment began with Zydis, a fast-acting freeze-dried tablet that disintegrates in your mouth. The technology is broad, and is in drugs today for everything from allergies to Parkinson’s disease. Today, the segment is much more than Zydis - Catalent works with inhalers and nasal delivery devices in this segment as well.
About a third of this revenue comes from the clinic - services to enable customers and clinical trial manufacturing. Commercial manufacturing was about 66% of this segment at YE2022.
*Catalent entered into a royalty agreement that actually took margins up up to ~38% in 4Q22.
Clinical Supply Services (“CSS”, 8% of revenue, 26% margin)
CSS is effectively a consulting business. Within the segment, Catalent helps customers procure raw materials, navigate regulatory issues, and anything else synergistic with the know-how the company has built off of its CDMO services.
Biologics (53% of revenue, 33% margin)
Biologics is why you would want to own this company. In the segment, Catalent offers a massive array of service capabilities, spanning process development services for complex biologic drugs, cell-line development, substance manufacturing, and fill-finish services.
Catalent has a surprisingly good reputation in this space, which is less surprising if you knew about Paragon before it got acquired. Paragon was one of the OG gene therapy specialists, doing process development and some substance manufacturing for the space before it was as prevalent as it is today. This reputation is already starting to bear fruit: Catalent will be the manufacturer of the entire workflow for Sarepta’s gene therapy for Duchenne’s if approved.
The important thing to understand about Catalent is that only 16% of biologics revenue was for commercial manufacturing. The other 84% was a combination of process development services and clinical trial supply. One way to read this is that Catalent’s biologics segment is much more exposed to the macro elements than that of a Lonza or Samsung. This is both a good and bad thing given it offers room for growth at the cost of some degree of visibility.
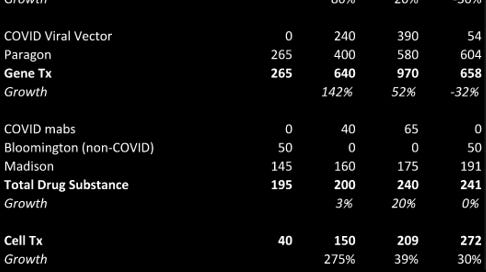
But wait, there’s more! Within biologics, the mix is worth understanding as well. Since I keep harping on how important it is to understand the difference between process development, fill finish, and substance, I’ve included some estimates of what biologics revenue is composed of below:
Note: Product = Fill-finish
As you can see, the big drivers today are Paragon (mostly process development + some gene therapy substance) and the fill-finish business, even after the sell-side made its cuts to estimates. As a reminder, biologics is about half of revenue which should give you a sense of total contribution to the business as well.
Today, Catalent has consolidated these segments into 2: Biologics, and Pharmaceuticals and Consumer Health (“PCH). Since PCH effectively consolidates all the above segments that are not biologics, it will get harder over time to parse out Catalent’s industrial/cyclical exposures, but I think this won’t matter if Biologics ends up dwarfing PCH over time.
Financial Overview
From a financial perspective, Catalent was a steady business before COVID, but things definitely looked wanting until it acquired Cook and Paragon. Revenue grew ~6% annualized from 2013-2018, with most of that growth happening in 2017 and 2018, largely from M&A and increasing end market exposure to biologics.
From a margin perspective, Catalent delivered margin expansion for the first couple years as a public company (from <23% EBITDA margin in 2013 to >24% in 2015), but things took a hit in 2016/17, due to the volume of M&A and margin implications, among other things. Biologics margins moved around a lot during that time, and softgels can be fickle with their macro exposure, and were a much larger part of the mix at the time. COVID has made it much harder to evaluate the recent margin trajectory, as has the lack of trust in Catalent’s accounting for both revenue and EBITDA during the pandemic.
Where it is easiest to pick on Catalent regardless of the pandemic, however, is cash flows. While EBITDA margins were floating around the 20-25% range from 2013-2021, operating cash flows were volatile in a range of 8-15% of sales. Furthermore, FCF was negative almost every single year if you bake in M&A (which I’d consider somewhat fair given the fact that most M&A is basically accelerated growth capex for CDMOs). For reference, if you use depreciation as a proxy for capex needed to maintain Catalent’s facilities, its true cash margins were floating from 3-10% in a given year before ANY investment in growth…
… at least that's what it looks like. However, it’s important to understand how messy a PnL or cash flow statement can look year-to-year with a manufacturing business. When you put a new facility online, its utilization rarely goes straight to a level high enough to make it look profitable. CDMOs are basically an offset-stack of these facilities coming online/being expanded, and at the same time M&A comes with restructuring costs. Suffice to say the cash flow pictures don’t tell the whole story. That is not to say management was doing a great job, either, just that how the actual underlying business has been doing is a hard-to-answer question during times of investment.
In my mind, 2014/2015 was the pair “getting your s**t together” years that private equity exits need to have before investing in growth, and Catalent has been somewhat aggressive investing in growth ever since then. As such, it’s almost impossible to know exactly how well-run these facilities are until investment cools down. I’d argue we got robbed of that opportunity when COVID struck. If I had to guess, however, I’d say that money was definitely left on the table throughout, given management incentives. Aggression in CDMOs almost HAS to have some level of inefficiency. If you can ignore the wasted money in the near term and look forward, these issues can usually be resolved down the road. This is why you see so much restructuring on the PnL.
What is more important, however, is the potential, which the whole industry has in spades. This is why most CDMOs get so much credit for EBITDA despite FCF issues - management uses the metric to try and show you how well the underlying business is doing. At some point, however, you’ll want/expect EBITDA and FCF to converge a fair bit. With all of the scrutiny on Catalent’s financials these days, the pressure is on to show it.
Valuation
From a comps perspective, Catalent is among the cheapest in its group. Given the recent issues the company has faced lately, this is of little surprise (I’ll elaborate later).
Historically, CTLT’s EV/NTM EBITDA (below) looked like that of a boring industrials company until just before COVID. 10-15x was more the norm, vs the high-teens+ you see on most of the bigger ones today. This is probably due to its status as a cyclical stock, which is probably largely gone given how much of its mix is pharma-driven today. The little spike you see at the end is probably the huge downward EBTIDA revisions that recently took place.
As for where Catalent SHOULD be trading, the multiple range seems to tell an obvious story. What you need to consider is what the forward numbers will look like, and how much variability there is in them. Consensus is assigning numbers between $800M to over $1B for Catalent’s EBITDA in FY24, a 25% step from low to high. So if you think Catalent’s multiple looks cheap at 11-12x FY24. Keep in mind that the mean CIQ estimate is $958M and the median is $910M just this difference almost makes a full-turn change in the multiple (~11.6x to 12.3x).
Personally, I think the right multiple should be a slight (10%-20%) discount to Lonza - which trades at 18x 2024 EBITDA, so let’s say 15x-16x whatever the real numbers end up being assuming the group doesn’t move too much. The rationale is pretty straightforward with Lonza having a much clearer competitive edge with cleaner execution but a lower ceiling on growth given its size.
What Makes Catalent Interesting
From a macro perspective, I think one should consider ANY biologics-heavy CDMO for the following reasons:
There is a secular shift toward outsourcing due to new drugs coming from biotech startups (2/3s of the mix) and new drugs becoming increasingly biologic in nature (has already grown to half of pipeline assets, and is probably more than half of startup biotech pipeline assets).
The latter tailwind supports biologics as an industry growing 10-12%; the outsourcing layer can easily add another 3% to the high end of the range (which is reflected in a lot of industry growth estimates saying 10-15%).
The industry will grow, but not all players benefit equally - the larger companies have access to cash flow and financing that most smaller players struggle to get.
The larger players tend to enjoy a trusted status across all existing and new customers, because the only way a CDMO survives long enough to grow to large-cap status is with consistent execution on customer projects.
Revenues are more predictable relative to legacy CDMOs. Given the above industry tailwinds, and the supply/demand stuff I talked about in my last article, the demand is obviously present. Customers are often loyal as well.
Taken together, the industry has a steady stream of new customers locking themselves into their CDMO partners with loyalty and switching costs, and the ones that succeed become long-term partners.
As for Catalent specifically, it is interesting for the following
Reputation: Catalent is one of the “larger players” mentioned above, and has a wide array of loyal large pharma customers in its legacy segments as well as in its biologics fill-finish business. It was no surprise that it won a lot of COVID business. It is a destination of first resort for anyone trying to do most of the things Catalent does
Specialist in Gene Therapy: Gene therapy is the area that is the hardest to play in because of difficulties producing AAV, the most commonly-demanded type of gene therapy today. Given how inefficient it is to produce, it is also the most mismatched supply-demand category as well. This gives Catalent some pricing power which provides a lot of upside potential to some of the numbers I toss out later on.
Valuation: It is plain to see that Catalent’s valuation is at an optical discount today on forward EBITDA numbers. Catalent’s accounting and cost control woes, combined with the need to restate historical numbers, have placed it in the doghouse with many investors, which I think creates the opportunity.
The TLDR is that Catalent is quality service asset in an excellent industry suffering from superficial things that likely don’t affect the long-term value of the asset.
What Went Wrong? Why Catalent is Down >70% from its Highs
Catalent was doing just fine before the pandemic, and the fact that it was chosen to become part of the COVID supply chain was an extremely fortunate development for the company. However, it also introduced a set of risks that clearly materialized over the last year.
While any manufacturing company LOVES it when demand fills out its capacity, given how much incremental margin comes with that last 10-20% utilization, COVID was a different beast altogether. Given the need to prioritize vaccine production, Catalent found itself pushing other client projects back into the queue, and from where it stood, demand was infinite. Furthermore, COVID projects were priced favorably to the manufacturers to ensure prioritization.
Historically, manufacturing companies grow very methodically - not too fast, because you don’t want under-used facilities, and not too slow, because you still want to show that you can grow, especially as a capital-intensive business.
So if you’re Catalent, or any other CDMO at the end of 2020, what do you do? You start accelerating capital expenditures and acquiring more aggressively. After all, you just got a huge influx of cash and you think demand will be infinite for a long time.
Furthermore, management’s compensation incentivized risky behavior. While having 91% of compensation be variable to performance metrics is nice to have, you need those metrics to be based on the right things. In this case, those items were “budget-based” revenue and EBITDA. The “adjusted” nature of these metrics should be concerning to any shareholder seeing this at any company. In this case, it incentivized categorization of revenue and its P&L impact to disconnect from cash flow.
If you read my writeup on Avantor, you’ll recall that I am highly skeptical of management teams that are incentivized to acquire without actual execution metrics on M&A itself. Avantor has a similar compensation dynamic that largely incentivizes maximizing revenue and EBITDA in a vacuum. This doesn’t work because there is no punishment for overpaying for a deal. In Catalent’s case, the scheme is even worse because of the fundamental nature of its business.
Here’s one you’ll love from the 2022 10-k. The Catalent definition of adjusted EBITDA:
“The measure under U.S. GAAP most directly comparable to Adjusted EBITDA is net earnings. In calculating Adjusted EBITDA, we add back certain non-cash, non-recurring, and other items that are deducted when calculating EBITDA from operations and net earnings, consistent with the requirements of the Credit Agreement. Adjusted EBITDA, among other things:
• does not include non-cash stock-based employee compensation expense and certain other non-cash charges;
• does not include cash and non-cash restructuring, severance, and relocation costs incurred to realize future cost savings and enhance operations;
• adds back any non-controlling interest expense, which represents minority investors’ ownership of non-wholly owned consolidated subsidiaries and is, therefore, not available; and
• includes estimated cost savings that have not yet been fully reflected in our results.”
Catalent’s board was allowing management to get credit for savings it hasn’t realized yet in EBITDA in FY22. You can’t make this up. Not a huge stretch to assume that it showed up in “budget-based EBITDA” too.
This all fell apart over the past few quarters, with Catalent missing numbers repeatedly, unable to put up a clean quarter. The CFO has turned over, and management has been forced to delay is 3Q filing a couple times, with a likely restatement of historicals ahead as well. In essence, parts of the short report were proven true.
This is also in the stock price, however. The question now is what the right numbers will be over the next few years.
Short-Term Opportunity: Catalent as an M&A Target
Earlier this year, there was speculation that Danaher, a large tools conglomerate, was considering acquiring Catalent. A subsequent rumor was that Danaher walked away from the deal. Despite the non-event, I think M&A is an important way to think about a potential exit for CDMOs, both to a strategic and to a private equity buyer. After all, private equity was quick to take out Baxter’s fill-finish business for a high-teens multiple. These businesses have all of the characteristics a PE buyer gets excited about.
Below is a short list of CDMO comps in Catalent’s universe (again):
As you can see, Catalent is suffering a major discount to most peers given its recent troubles. However, a buyer would probably need to believe it could make money paying market multiples for the asset. In short, if a deal happened, you could easily expect a 60%+ premium to Catalent’s price today. I saw at least one sell-side analyst claim a takeout would happen close to $100 a share. If Catalent were willing to sell for any less, given where its maximum revenue and earnings potentials are, I’d be shocked if investors didn’t prevent a sale.
Personally, I don’t think this is enough of a reason to own CTLT, but the likelihood of M&A interest does get me surprised that the market hasn’t put a higher floor on Catalent’s valuation.
Longer-term, however, I think Catalent is compelling based more squarely on favorable end-markets, obvious demand ahead, and significant capacity to meet it without significant capex.
Long-Term Opportunity: Understanding Revenue and Earnings Power
For any CDMO to be a great investment over the long term, especially Catalent, you need to be able to answer the following four questions, among others:
Does end market demand balance out with my CDMO’s capacity expansion?
Does my CDMO have the ability to win a reasonable share of demand?
What is the maximum revenue potential of my CDMO’s current and future capacity expectations?
What level of steady-state utilization can I expect?
As it relates to the Catalent story, you basically need to be able assert the following to own it:
The market will continue to return to an excess-demand environment for high-quality biologics CDMO services, allowing the top players to enjoy high levels of utilization
Despite its accounting issues, Catalent’s perceived quality as a service is still strong relative to the majority of peers, making it one of the aforementioned beneficiaries
Catalent has enough capacity to put up significant revenue growth and margin expansion over time
Catalent can manage costs and maintain utilization levels high enough to support margin recovery
Frankly, I don’t think these are hard to get comfy with, based solely off of public disclosure.
What High Utilization Looks Like
I think this is an important thing to conceptualize - 100% utilization is nearly impossible to achieve. To get there (and stay there) requires the following:
Long, non-stop customer contracts occupying capacity all year
No new capacity coming online the same year
The second disqualifies most CDMOs from the magic 100% number right off the bat. This generally implies that, in drug substance, you are producing for commercial production. This is not Catalent. Catalent largely produces clinical trial supply, meaning it will spend a few months or less of bioreactor time on a single client and switch to the next project. The time it takes to switch makes it structurally impossible to run at 100%.
In fill-finish, things are a little simpler in terms of switching, but the runs also get done more quickly (these are effectively high-speed vial/bag filling lines), meaning you’re switching more frequently. This makes it arguably even harder to stay at 100%, especially when you’re one of the largest in fill-finish like Catalent.
The margin implications are large. Catalent’s EBITDA margins have floated in the low- to mid-20s until biologics became a bigger contributor, but even in 2019 and 2020 its biologics margins were mid-20s.
By contrast, Baxter recently sold its CDMO business, which was largely a fill-finish asset, with margins near 40%. This likely is what happens when you max out your capacity and don’t re-invest in the segment - margins top out because you’re running as close to 100% as possible.
Therefore, the way I think about CDMO services from a margin perspective is that they are all priced to reach 35-40% at max capacity on a per-facility basis. This is probably different for the fancier stuff like gene therapy, which is harder to do and therefore earns a premium.
Do Long-Term Conditions Support High Utilization?
They sure look like they do.
You may recall the following chart from my CDMO primer:
Source: IQVIA
This is the most important driver of CDMO industry growth, in my opinion. Startup biotechs are highly incentivized to outsource manufacturing. Almost 100% of them do. This is because VC dollars are suboptimally spent if they go to capex (why build a facility to manufacture the drug if you don’t know it will work?).
The only exception was pandemic, because supply/demand got so mismatched that lead times were in excess of 2 years for certain unlucky players. Many of these companies are now selling their facilities to try and avoid a round of venture capital given the funding environment.
Consider also from part I that biologic drugs are becoming an increasingly large portion of new drugs:
Taken together, it’s easy to see how the number of biologic products being outsourced has been growing double-digits for quite some time. Funding put a damper on biologics growth this year, but it is important to note that it is because a high percentage of biologics are still clinical assets today. Jefferies did a scrape of Clinicaltrials.gov and found that phase 1 assets have historically been the fastest-growing among different trial types, which was a likely driver of biologics growth:
While the number of products entering the clinic may have lapsed, there is another dynamic that could plug the gap this year and provide a further tailwind over the next couple of years: these early assets are progressing to subsequent phases. In the first quarter of the year, phase 3 trials returned to growth!
This matters because you have to enroll a larger trial when you progress from one phase to the next. The biggest jump happens when you got from phase 2 to phase 3, but the magnitude of this jump has moved around a lot over the years. This is where things get even more interesting.
If you ignore the period where trials obviously included COVID-19 vaccine studies (massive N), the range was clearly a 4x-6x jump from phase 2 to phase 3 in terms of number of patients being enrolled. Naturally, then, you’d expect the post-covid number to fall back into the range - but it didn’t! This likely means that trials are getting bigger in a secular way. There are lots of likely reasons for this. Perhaps biopharma companies don’t want to risk missing an endpoint on a p-value somewhere. Perhaps they know that if they over-enroll, they can use biomarkers after a failure to salvage the trial by indicating a smaller, more targeted patient population.
This has major implications for bioprocessing as a whole: more enrolled patients = more drug being manufactured before something even goes commercial.
In summary, we knew the following before…
The BioTRAK database (from BDO) estimates that demand will grow at ~11% while supply will grow ~7% annually from 2022-2026. (See CDMO primer)
Current capacity cannot fully support the future needs of the market if a few blockbuster biologics need to be outsourced, among other things that could happen(See CDMO primer)
… which is exciting long-term, but you also don’t want to be blindsided by timing. Thanks to the above analysis by David Windley, however, we know that there is an increasingly large margin of safety:
Phase 3 trials counts are returning to growth (and 1/2 is showing signs of leveling of)
Phase 3 trials are getting larger relative to phase 2 in a meaningful way
Taken together, near-term tailwinds can start bridging any potential gap as soon as later this year and provide a material lift in CY2024 with the potential to prove durable. This should allay most fears of being able to fill capacity at the top CDMOs.
Is the Business Permanently Impaired?
The short answer is no, in my view. I believe investors are conflating the accounting issues the company had and the macro for actual damage to the company’s reputation.
The only real negative development that could have affected Catalent was the FDA’s 483 letters (forms the FDA sends to warn manufacturers about possible compliance breaches) sent last fall. These have since been cleared, however, press releases show renewals and customer wins for Catalent. I’d encourage you to look at some of the press releases Catalent has put out since the letters were issued to get comfortable with this, because it’s the only potential hole in Catalent’s perceived quality.
It’s unlikely, in my view, that the accounting problems have anything to do with Catalent’s business quality, but investors are likely conflating the two. The current macro situation and moving revenue numbers makes it easy to do so and feel like one is “getting it right”.
If you assume that I am right about Catalent NOT being fundamentally impaired following the accounting/guidance fiasco, as well as my assertions about long-term supply/demand for CDMO services being in excess-demand mode, then what you should really care about is Catalent’s current revenue capacity and associated earnings power.
How Much Revenue Can Catalent Produce with its Current Capacity?
Before we dive in here, I want to caution that I am going to be oversimplifying. Biologics is just over half of Catalent’s business, but I am using company-wide numbers for a lot of the ensuing analysis. I think this works just fine because historical numbers speak for themselves, seem directionally in-line with what you’d expect to see, and biologics is still most or all of new capacity being added at CTLT.
Let’s assume Catalent was playing games with its revenue accounting, and that those contract assets on its balance sheet shouldn’t have existed. Glasshouse estimated that ~12% of sales were wrongly put into long-term contract assets that allowed early revenue booking.
Coincidentally, new guidance at the midpoint currently calls for an 11% decline in revenue over FY22 (which needs to be restated, but the relative move is encouraging). When you take into account added capacity and the Metrics acquisition, the implication here is that the pre-M&A/capex drop from FY22 is even steeper: 12% decline ex-M&A, and ~15% fully-loaded for capex since then. This makes me comfortable that forward looking numbers are at least close to shenanigans-free while giving some cushion for macro headwinds.
In its 10-k, Catalent discloses its facilities and rough square footage, which I’m using as a key input for “capacity”. It is challenging to parse out each of Catalent’s contributions by facility given the huge overlap in many of its sites, but I’d argue you don’t have to.
Here is what company-wide revenue, footprint, and rev/sqft look like based on history and some estimation:
Directionally this lines up well with biologics mix in recent years if you assume a higher revenue/footprint for biologics specifically:
The latest FY23 guidance calls for 4.3B in revenue in FY23 at the midpoint with $750M in EBITDA. I’d estimate that the total footprint at Catalent is currently around 8.5M square feet (roughly 8.1M sqft in FY22 + 330k for Metrics and the rest from capex). The key question, however, is where FY24 will land.
Below is some math that I’m using to back into what level of utilization is implied by the FY23 guidance based on where I think FY21/22 and prior was.
I think 75% utilization is reasonable and the priors are as well because of what they imply about max revenue capacity (a steady uptrend without too much volatility). Not that my max revenue capacity estimate is actually below what management is saying it can do in its long-term plan ($6.5B after taking out $1B from its plan a few weeks ago). Keep in mind that these things are all relative to each other across time periods anyway, but I think I’m in the right ballpark.
What this analysis is saying is that if max revenue capacity/sqft stays flat, utilization stays flat, and footprint grows a little, then revenue will grow 2%. Shocker. However, if you take the above commentary about how things may start to get a little rosier from a macro perspective, you can start to apply some upward revision to the utilization numbers, and perhaps even the max rev/sqft number as well on pricing/mix. An approval for Sarepta’s DMD drug alone would make it all but certain you can get higher than my 75% utilization estimate.
This is what that sensitivity looks like:
As you can see above, utilization going up 5% with a little pricing (2%) on top gets you into high-single-digits-above-baseline territory. Compare this to consensus revenue estimates:
Not crazy to think Catalent beats on current consensus revenue in FY24 if you believe utilization goes up on the many possible industry tailwinds out there (GLP-1s, Alzheimers,) as well as Catalent-specific things like Sarepta if it were to get approved. From here, EBITDA matters. Consensus has EBITDA at $958M and margins at 21.5% in FY24. Taking the 80% utilization + 2% pricing example, you can add in COGS/sqft and SG&A/sqft (adjusted numbers) and end up with some pretty compelling EBITDA estimates:
This oversimplifies adj. EBITDA a little (historicals won’t match perfectly), but the amount of margin cushion there more than makes up for it. Here’s the sensitivity, however, as it’s important to be aware of what the range of outcomes look like if you believe my estimates. Keep in mind that COGS/sqft is an important variable that isn’t accounted for here, so the curve steepens too quickly in each direction vs what would actually happen.
Risks
These are obvious so I’ll keep this section brief:
Utilization falling = lower revenue and much lower margins
Failure to control costs could ruin the EBITDA story even if revenue does well
Accounting issues not being fully resolved could reveal more issues with historicals that affect guidance again.
25-30% of Catalent’s revenue is exposed to some degree to traditional macro and could suffer in the even of a recession
Funding issues could persist or Catalent could fail to benefit from the large trial trends mentioned above
Quantifying Upside/Downside
From $38 a share, I think the upside/downside looks attractive. I’m using my above example of 80% utilization/2% pricing for a base case and slapping a 14x multiple on it, conservative to the 15x-16x I think it might deserve.
For a bear case, I assume utilization slips, and EBITDA margins decline further from what management is guiding for FY23. With a 12x multiple on that (expansion because this would double as a de-risking event for numbers), downside could be ~30%.
Taken together, the upside/downside on these two scenarios is 2.4-to-1. I think probability favors the base case at this point, further skewing the ratio on a probability-adjusted basis. Combine these with the fact that you still have potential for M&A and you have a pretty attractive cone of outcomes.
Conclusion
Overall, I prefer tools businesses to CDMOs due to capital intensity. However, you can’t ignore how much value is likely to accrue to these companies over the next 5 years. With Catalent trading where it is and what appears to be a near-trough in biologics funding, I think it’s time investors consider getting off the sidelines in biologics, and that value-oriented investors consider looking at Catalent.
I would be remiss if I didn’t point out, however, that there are several assets across life sciences trading cheap relative to history in tools and CROs as well. The sheer number of opportunities that have popped up over the past 6 months have been a key reason I haven’t been able to make space for a position yet. Make sure you turn over a few stones before deciding that CTLT is the way to go. Hopefully the above helps in making that decision.
Thanks for reading!
Really enjoyed this write up! Curious at the end you mentioned other opportunities are potentially more attractive. What tools in particular are you more interested in - or just companies like AVTR? Any views on DHR?